Stellar Light Curves
Astrophysics · TESS data · October 2025–June 2026
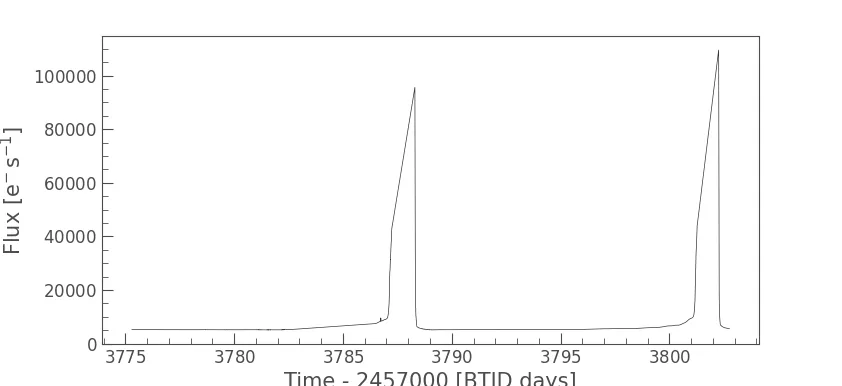
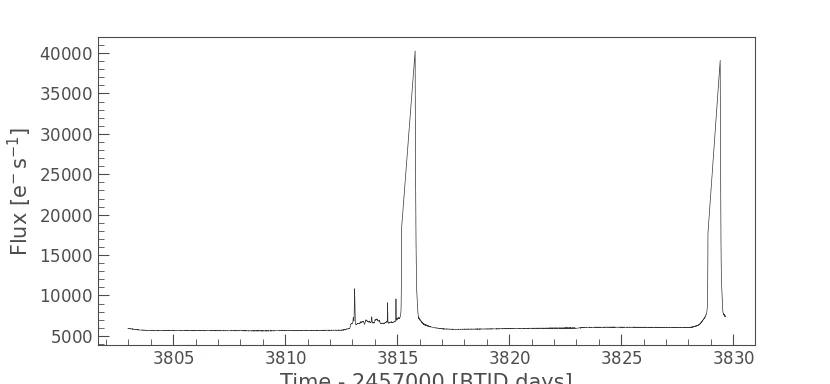
Working directly with data from NASA’s TESS satellite, I built a pipeline to detect and characterize stellar flares and to study how the brightness of stars changes over time. The work led to a co-authored research submission reporting a previously unreported variable star with frequent high-energy flares. An early version, comparing measurements from two satellites, was my class project for Physics 23 at Santa Monica College in Fall 2025.
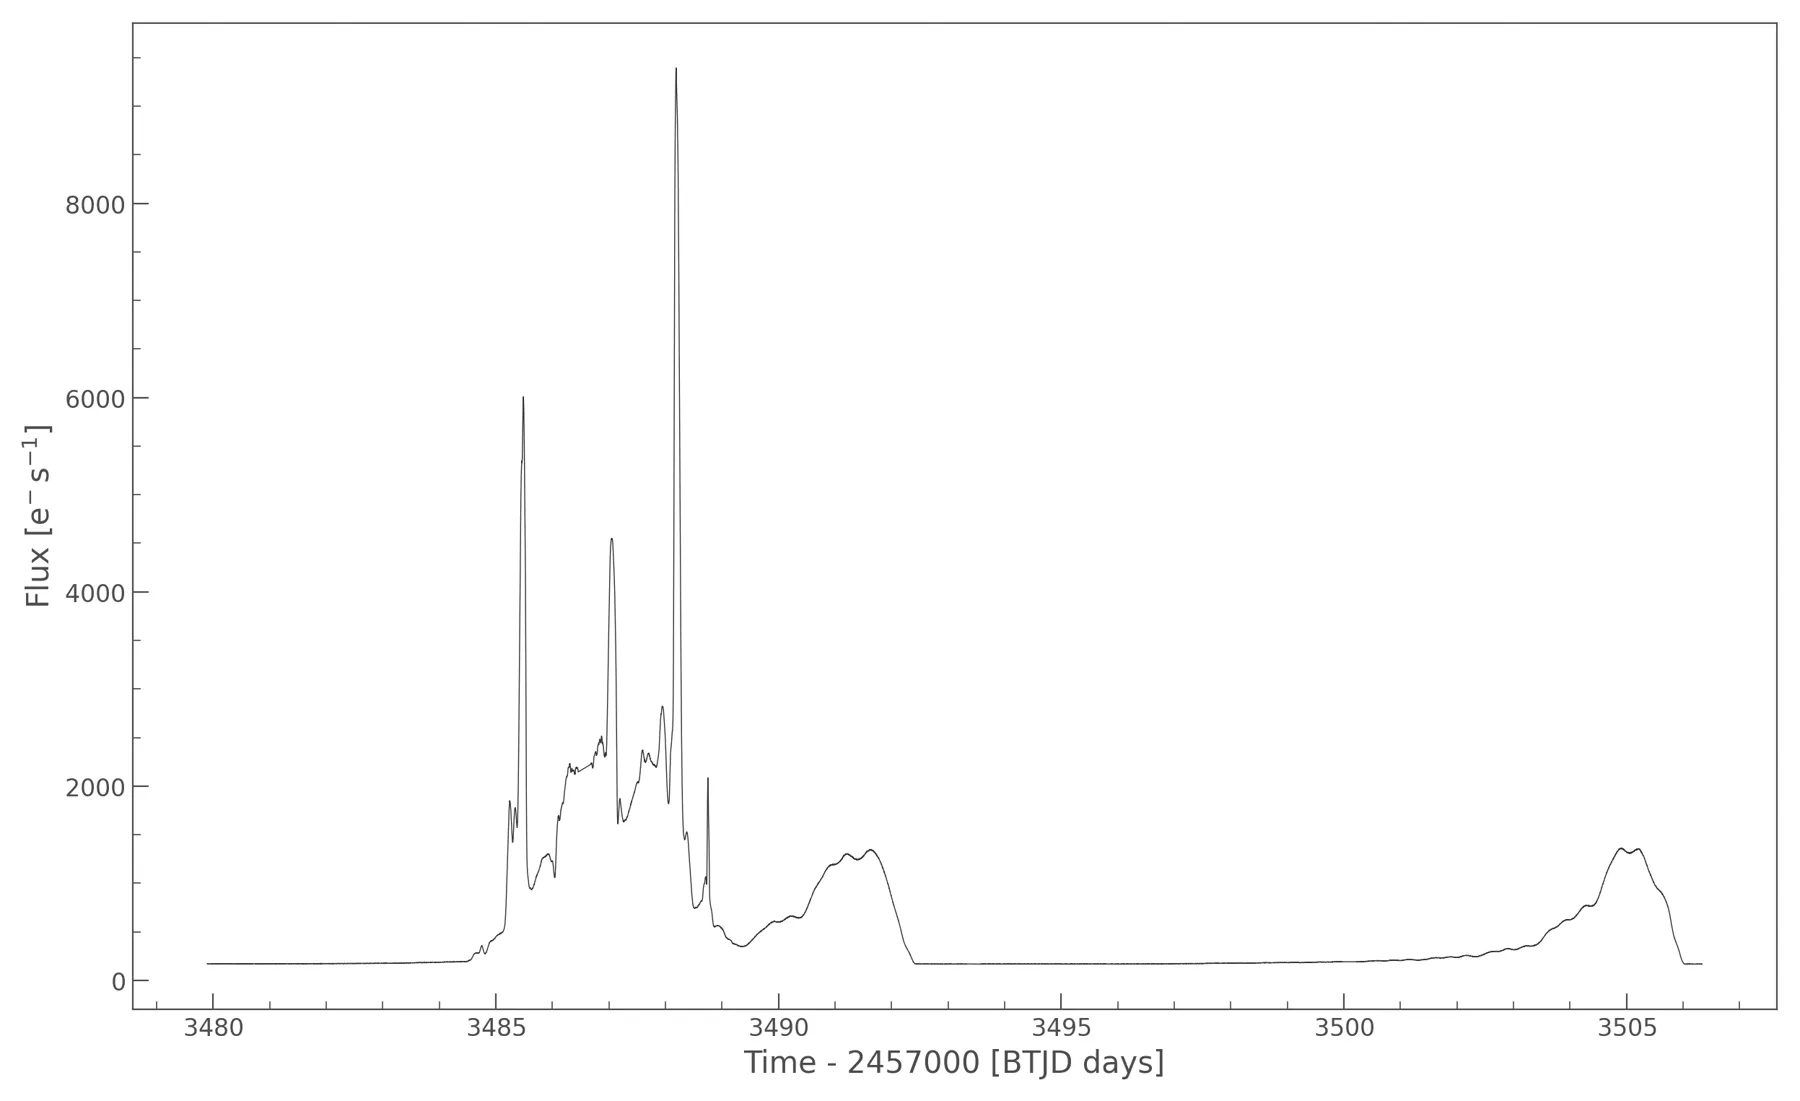
Is the flare on the star?
A spike in brightness is not enough: in TESS’s large pixels, light from a neighbouring star can masquerade as a flare. For each cadence the pipeline computes the flux-weighted centroid of the aperture,
and compares it between a pre-flare baseline and the flare peak. If the centroid shifts toward another source, the emission is likely contamination; if it stays on the target’s WCS-projected position, the flare is the target’s own.
Code
For one target: build an aperture-masked light curve, detrend it and flag flares as runs of points above 3σ of the robust noise, compute flux-weighted centroids at every cadence, and test whether the centroid moves significantly, and toward or away from the target, during the strongest flare. Ends with a verdict and a diagnostic figure.
lightkurveastropynumpymatplotlibTESS TPFWCS
"""
pipeline.py — flare detection and centroid vetting for a single TESS target.

Given a TESS Target Pixel File (TPF) cutout, this script

  1. builds an aperture-masked light curve,
  2. detrends it and flags flare candidates (runs of points well above the
     robust noise level),
  3. computes flux-weighted centroids at every cadence,
  4. compares the centroid during the strongest flare against a quiet
     pre-flare baseline, and
  5. projects the catalogue position of the target onto the pixel grid.

If the light centroid moves significantly during a flare, and moves *away* from
the target, the flare most likely comes from a neighbouring star that shares
TESS's large (21") pixels rather than from the target itself.

Usage
-----
    python pipeline.py data/tess-s0080-2-2_270.420554_28.932725_30x30_astrocut.fits \
        --ra 270.420554 --dec 28.932725 --name "TIC 1603615314"
"""

from __future__ import annotations

import argparse
from dataclasses import dataclass
from pathlib import Path

import astropy.units as u
import matplotlib.pyplot as plt
import numpy as np
from astropy.coordinates import SkyCoord
from lightkurve import LightCurve, TessTargetPixelFile


# ---------------------------------------------------------------------------
# Data containers
# ---------------------------------------------------------------------------

@dataclass
class Flare:
    """A contiguous run of cadences above the detection threshold."""
    start: int          # first cadence index
    stop: int           # last cadence index (inclusive)
    peak: int           # index of maximum flux within the run
    peak_time: float    # BTJD
    amplitude: float    # peak relative flux above the detrended baseline


@dataclass
class CentroidShift:
    """Centroid motion between a quiet baseline cadence and a flare peak."""
    baseline_idx: int
    peak_idx: int
    dx: float           # pixels
    dy: float           # pixels
    shift: float        # pixels, sqrt(dx^2 + dy^2)
    significance: float # shift in units of the quiet-time centroid scatter
    toward_target: bool # does the centroid move toward the target's position?


# ---------------------------------------------------------------------------
# 1. Light curve
# ---------------------------------------------------------------------------

def build_light_curve(tpf: TessTargetPixelFile, threshold: float = 3.0):
    """Aperture-masked light curve.

    Pixels brighter than `threshold` times the background median form the
    aperture. The *same* mask is reused for flare detection and centroiding so
    that all three measurements describe exactly the same pixels.
    """
    mask = tpf.create_threshold_mask(threshold=threshold)
    lc = tpf.to_lightcurve(aperture_mask=mask).remove_nans()
    return mask, lc


# ---------------------------------------------------------------------------
# 2. Flare detection
# ---------------------------------------------------------------------------

def robust_sigma(x: np.ndarray) -> float:
    """Standard deviation estimated from the median absolute deviation."""
    x = x[np.isfinite(x)]
    return 1.4826 * np.median(np.abs(x - np.median(x)))


def detect_flares(lc: LightCurve, n_sigma: float = 3.0, min_points: int = 3,
                  window_length: int = 401) -> tuple[list[Flare], LightCurve]:
    """Flag flares as runs of >= `min_points` cadences above `n_sigma`.

    The light curve is first flattened (a Savitzky–Golay filter removes slow
    trends such as rotational modulation and scattered light), so the
    threshold is applied to the residual relative flux.
    """
    flat = lc.normalize().flatten(window_length=window_length)
    resid = flat.flux.value - 1.0
    sigma = robust_sigma(resid)
    above = resid > n_sigma * sigma

    flares: list[Flare] = []
    i, n = 0, len(above)
    while i < n:
        if not above[i]:
            i += 1
            continue
        j = i
        while j + 1 < n and above[j + 1]:
            j += 1
        if j - i + 1 >= min_points:
            peak = i + int(np.nanargmax(resid[i:j + 1]))
            flares.append(Flare(i, j, peak, float(flat.time.value[peak]),
                                float(resid[peak])))
        i = j + 1

    flares.sort(key=lambda f: f.amplitude, reverse=True)
    return flares, flat


# ---------------------------------------------------------------------------
# 3. Flux-weighted centroids
# ---------------------------------------------------------------------------

def flux_weighted_centroids(flux: np.ndarray, mask: np.ndarray):
    """Centroid (x_c, y_c) of the aperture flux at every cadence.

        x_c = sum(x * F) / sum(F),   y_c = sum(y * F) / sum(F)

    `flux` has shape (n_cadences, ny, nx). Pixels outside the aperture are set
    to NaN so they contribute nothing.
    """
    masked = flux.copy()
    masked[:, ~mask] = np.nan
    ny, nx = flux.shape[1:]
    y, x = np.mgrid[0:ny, 0:nx]
    total = np.nansum(masked, axis=(1, 2))
    with np.errstate(invalid="ignore", divide="ignore"):
        cx = np.nansum(x * masked, axis=(1, 2)) / total
        cy = np.nansum(y * masked, axis=(1, 2)) / total
    return cx, cy


# ---------------------------------------------------------------------------
# 4. Centroid shift during the strongest flare
# ---------------------------------------------------------------------------

def quiet_baseline(peak: int, valid: np.ndarray, offset: int = 10) -> int:
    """A valid cadence `offset` steps before the peak (or after, near the start)."""
    step = -1 if peak >= offset else 1
    idx = peak + step * offset
    while 0 < idx < len(valid) - 1 and not valid[idx]:
        idx += step
    return idx


def centroid_shift(cx, cy, peak: int, target_xy: tuple[float, float],
                   quiet: np.ndarray) -> CentroidShift:
    valid = np.isfinite(cx) & np.isfinite(cy)
    base = quiet_baseline(peak, valid)
    dx, dy = cx[peak] - cx[base], cy[peak] - cy[base]
    shift = float(np.hypot(dx, dy))

    # How much does the centroid wander when nothing is happening?
    scatter = np.hypot(robust_sigma(cx[quiet & valid]), robust_sigma(cy[quiet & valid]))
    significance = shift / scatter if scatter > 0 else np.inf

    # Moving toward the target means the distance to it shrinks during the flare.
    tx, ty = target_xy
    d_before = np.hypot(cx[base] - tx, cy[base] - ty)
    d_during = np.hypot(cx[peak] - tx, cy[peak] - ty)

    return CentroidShift(base, peak, float(dx), float(dy), shift,
                         float(significance), bool(d_during <= d_before))


# ---------------------------------------------------------------------------
# 5. Target position on the pixel grid
# ---------------------------------------------------------------------------

def target_pixel(tpf: TessTargetPixelFile, ra: float, dec: float) -> tuple[float, float]:
    coord = SkyCoord(ra=ra * u.deg, dec=dec * u.deg)
    x, y = tpf.wcs.world_to_pixel(coord)
    return float(x), float(y)


# ---------------------------------------------------------------------------
# Plots
# ---------------------------------------------------------------------------

def plot_diagnostics(tpf, mask, lc, flat, flares, cx, cy, shift, target_xy,
                     name: str, out: Path | None = None):
    fig, axes = plt.subplots(1, 2, figsize=(13, 4.5),
                             gridspec_kw={"width_ratios": [2.2, 1]})

    # Light curve with flare candidates
    ax = axes[0]
    ax.plot(lc.time.value, lc.flux.value, lw=0.7, color="0.2")
    for f in flares:
        ax.axvspan(lc.time.value[f.start], lc.time.value[f.stop], color="C3", alpha=0.25)
    ax.set_xlabel("Time [BTJD]")
    ax.set_ylabel("Aperture flux [e⁻/s]")
    ax.set_title(f"{name}: {len(flares)} flare candidate(s)")

    # Pixel image with aperture, centroids, and target
    ax = axes[1]
    image = np.nanmedian(tpf.flux.value, axis=0)
    ax.imshow(image, origin="lower", cmap="gray_r")
    ax.contour(mask, levels=[0.5], colors="C0", linewidths=1)
    b, p = shift.baseline_idx, shift.peak_idx
    ax.plot(cx[b], cy[b], "o", color="C0", label="baseline centroid")
    ax.plot(cx[p], cy[p], "o", color="C3", label="flare centroid")
    ax.annotate("", xy=(cx[p], cy[p]), xytext=(cx[b], cy[b]),
                arrowprops=dict(arrowstyle="->", color="C3"))
    ax.plot(*target_xy, "+", color="C2", ms=12, mew=2, label="target (WCS)")
    ax.set_title(f"shift {shift.shift:.3f} px ({shift.significance:.1f}σ)")
    ax.legend(loc="upper right", fontsize=8)

    fig.tight_layout()
    if out:
        fig.savefig(out, dpi=200)
    plt.show()


# ---------------------------------------------------------------------------
# Driver
# ---------------------------------------------------------------------------

def analyze(path: Path, ra: float, dec: float, name: str, plot: bool = True):
    tpf = TessTargetPixelFile(path)
    mask, lc = build_light_curve(tpf)

    flares, flat = detect_flares(lc)
    if not flares:
        print(f"{name}: no flare candidates above threshold.")
        return None

    # Map the strongest flare from light-curve time back to a TPF cadence.
    strongest = flares[0]
    tpf_time = tpf.time.value
    peak = int(np.nanargmin(np.abs(tpf_time - strongest.peak_time)))

    cx, cy = flux_weighted_centroids(tpf.flux.value, mask)

    # Quiet cadences: everything not inside any flare.
    in_flare = np.zeros(len(tpf_time), dtype=bool)
    for f in flares:
        t0, t1 = lc.time.value[f.start], lc.time.value[f.stop]
        in_flare |= (tpf_time >= t0) & (tpf_time <= t1)

    txy = target_pixel(tpf, ra, dec)
    shift = centroid_shift(cx, cy, peak, txy, quiet=~in_flare)

    print(f"{name}")
    print(f"  flare candidates:      {len(flares)}")
    print(f"  strongest flare:       BTJD {strongest.peak_time:.4f}, "
          f"+{100 * strongest.amplitude:.2f}% above baseline")
    print(f"  centroid shift:        dx={shift.dx:+.4f} px, dy={shift.dy:+.4f} px "
          f"({shift.significance:.1f}σ)")
    print(f"  target pixel position: x={txy[0]:.2f}, y={txy[1]:.2f}")
    verdict = ("consistent with the target" if shift.significance < 3 or shift.toward_target
               else "likely from a nearby contaminating source")
    print(f"  verdict:               {verdict}")

    if plot:
        plot_diagnostics(tpf, mask, lc, flat, flares, cx, cy, shift, txy, name,
                         out=path.with_suffix(".diagnostics.png"))
    return flares, shift


def main():
    parser = argparse.ArgumentParser(description=__doc__,
                                     formatter_class=argparse.RawDescriptionHelpFormatter)
    parser.add_argument("tpf", type=Path, help="TESS target pixel file (FITS)")
    parser.add_argument("--ra", type=float, required=True, help="target RA [deg]")
    parser.add_argument("--dec", type=float, required=True, help="target Dec [deg]")
    parser.add_argument("--name", default="target")
    parser.add_argument("--no-plot", action="store_true")
    args = parser.parse_args()
    analyze(args.tpf, args.ra, args.dec, args.name, plot=not args.no_plot)


if __name__ == "__main__":
    main()
The same idea scaled to a whole open cluster: select NGC 2516 members from Gaia DR3 by parallax and proper motion, cross-match to the TESS Input Catalog, download and stitch every light curve, extract variability features (amplitude, skewness, von Neumann ratio, Lomb–Scargle period, flare count), and rank stars with an Isolation Forest.
astroquerylightkurveGaia DR3TESS TICpandasscipyscikit-learn
"""
scanning.py — variability and anomaly survey of the open cluster NGC 2516.

NGC 2516 (RA 119.52°, Dec −60.75°, ~408 pc) has several hundred bright members
and lies near TESS's southern continuous viewing zone, so it has been observed
in many sectors. This pipeline turns the cluster into a light-curve dataset and
ranks its stars by how unusual their variability is.

  Phase 1  Gaia DR3 membership: stars in a 0.75° cone whose parallax and proper
           motion match the cluster (box cuts after Cantat-Gaudin et al. 2018).
  Phase 2  Cross-match each member to the TESS Input Catalog (TIC).
  Phase 3  Download TESS light curves (2-min SPOC preferred, QLP fallback),
           normalise, stitch sectors, and clean.
  Phase 4  Extract variability features from each light curve.
  Phase 5  Score stars with an Isolation Forest; the most isolated points in
           feature space are the anomaly candidates worth a closer look.

Usage
-----
    python scanning.py                    # all available sectors
    python scanning.py --sectors 61 62    # restrict to specific sectors
"""

from __future__ import annotations

import argparse
import warnings
from pathlib import Path

import astropy.units as u
import lightkurve as lk
import numpy as np
import pandas as pd
from astropy.coordinates import SkyCoord
from astroquery.gaia import Gaia
from astroquery.mast import Catalogs
from scipy.stats import kurtosis, skew
from sklearn.ensemble import IsolationForest
from sklearn.preprocessing import RobustScaler

warnings.filterwarnings("ignore")

DATA_DIR = Path("data/ngc2516")
CLUSTER_RA, CLUSTER_DEC, RADIUS_DEG = 119.52, -60.75, 0.75


# ---------------------------------------------------------------------------
# Phase 1 — Gaia DR3 membership
# ---------------------------------------------------------------------------

GAIA_QUERY = f"""
SELECT source_id, ra, dec, parallax, parallax_error, pmra, pmdec,
       phot_g_mean_mag, phot_bp_mean_mag, phot_rp_mean_mag, bp_rp, radial_velocity
FROM gaiadr3.gaia_source
WHERE CONTAINS(POINT(ra, dec), CIRCLE({CLUSTER_RA}, {CLUSTER_DEC}, {RADIUS_DEG})) = 1
  AND parallax BETWEEN 2.1 AND 2.9          -- ~345–475 pc
  AND pmra     BETWEEN -5.5 AND -3.5        -- mas/yr
  AND pmdec    BETWEEN 11.0 AND 13.0        -- mas/yr
  AND phot_g_mean_mag < 14.0
  AND parallax_error < 0.2
"""


def query_members() -> pd.DataFrame:
    print("Phase 1  Querying Gaia DR3 for NGC 2516 members…")
    members = Gaia.launch_job(GAIA_QUERY).get_results().to_pandas()
    print(f"         {len(members)} candidate members")
    return members


# ---------------------------------------------------------------------------
# Phase 2 — TIC cross-match
# ---------------------------------------------------------------------------

def crossmatch_tic(members: pd.DataFrame, radius_arcsec: float = 5.0,
                   max_tmag: float = 13.5) -> pd.DataFrame:
    """Brightest TIC source within `radius_arcsec` of each Gaia member."""
    print("Phase 2  Cross-matching to the TESS Input Catalog…")
    tic_id, tmag = [], []
    for ra, dec in zip(members["ra"], members["dec"]):
        coord = SkyCoord(ra=ra * u.deg, dec=dec * u.deg)
        hits = Catalogs.query_region(coord, radius=radius_arcsec * u.arcsec, catalog="TIC")
        if len(hits):
            hits.sort("Tmag")
            tic_id.append(int(hits["ID"][0]))
            tmag.append(float(hits["Tmag"][0]))
        else:
            tic_id.append(np.nan)
            tmag.append(np.nan)

    out = members.assign(tic_id=tic_id, Tmag=tmag).dropna(subset=["tic_id"])
    out = out[out["Tmag"] < max_tmag].reset_index(drop=True)
    out["tic_id"] = out["tic_id"].astype(int)
    print(f"         {len(out)} stars matched with Tmag < {max_tmag}")
    return out


# ---------------------------------------------------------------------------
# Phase 3 — Light curves
# ---------------------------------------------------------------------------

def fetch_light_curve(tic_id: int, sectors: list[int] | None) -> lk.LightCurve | None:
    """Download, normalise, stitch, and clean all available sectors for one star."""
    target = f"TIC {tic_id}"
    search = lk.search_lightcurve(target, mission="TESS", author="SPOC",
                                  exptime=120, sector=sectors)
    flux_column = "pdcsap_flux"
    if len(search) == 0:                       # fall back to QLP full-frame-image photometry
        search = lk.search_lightcurve(target, mission="TESS", author="QLP", sector=sectors)
        flux_column = "sap_flux"
    if len(search) == 0:
        return None

    lcs = search.download_all(flux_column=flux_column, quality_bitmask="hardest")
    if lcs is None or len(lcs) == 0:
        return None
    lc = lcs.stitch(corrector_func=lambda x: x.remove_nans().normalize())
    return lc.remove_nans().remove_outliers(sigma_upper=10, sigma_lower=5)


def download_all(stars: pd.DataFrame, sectors: list[int] | None,
                 min_points: int = 200) -> dict[int, lk.LightCurve]:
    print("Phase 3  Downloading TESS light curves…")
    curves, log = {}, []
    for i, tic_id in enumerate(stars["tic_id"], 1):
        try:
            lc = fetch_light_curve(tic_id, sectors)
            if lc is None:
                status = "no_data"
            elif len(lc) < min_points:
                status = "too_short"
            else:
                curves[tic_id] = lc
                lc.to_fits(DATA_DIR / f"tic{tic_id}.fits", overwrite=True)
                status = "ok"
        except Exception as e:                  # network hiccups, corrupt files, …
            status = f"error: {e}"
        log.append({"tic_id": tic_id, "status": status})
        print(f"\r         {i}/{len(stars)}  ({len(curves)} ok)", end="")
    print()
    pd.DataFrame(log).to_csv(DATA_DIR / "download_log.csv", index=False)
    return curves


# ---------------------------------------------------------------------------
# Phase 4 — Variability features
# ---------------------------------------------------------------------------

def count_flares(lc: lk.LightCurve, n_sigma: float = 3.0, min_points: int = 3) -> int:
    """Number of runs of >= min_points consecutive cadences above n_sigma."""
    resid = lc.flatten(window_length=401).flux.value - 1.0
    sigma = 1.4826 * np.median(np.abs(resid - np.median(resid)))
    above = resid > n_sigma * sigma
    edges = np.diff(np.concatenate([[0], above.astype(int), [0]]))
    starts, stops = np.where(edges == 1)[0], np.where(edges == -1)[0]
    return int(np.sum(stops - starts >= min_points))


def features(lc: lk.LightCurve) -> dict[str, float]:
    f = lc.flux.value
    f = f[np.isfinite(f)]
    diffs = np.diff(f)
    pg = lc.to_periodogram(method="lombscargle", minimum_period=0.05, maximum_period=15)
    return {
        "std": float(np.std(f)),
        "mad": float(np.median(np.abs(f - np.median(f)))),
        "amplitude": float(np.percentile(f, 95) - np.percentile(f, 5)),
        "skew": float(skew(f)),                  # flares give strong positive skew
        "kurtosis": float(kurtosis(f)),
        "von_neumann": float(np.mean(diffs**2) / np.var(f)),  # small = smooth, correlated variability
        "period_days": float(pg.period_at_max_power.value),
        "ls_power": float(pg.max_power.value),
        "n_flares": count_flares(lc),
    }


def extract_features(curves: dict[int, lk.LightCurve]) -> pd.DataFrame:
    print("Phase 4  Extracting variability features…")
    rows = [{"tic_id": tic, **features(lc)} for tic, lc in curves.items()]
    return pd.DataFrame(rows)


# ---------------------------------------------------------------------------
# Phase 5 — Anomaly scoring
# ---------------------------------------------------------------------------

def score_anomalies(feats: pd.DataFrame, contamination: float = 0.05) -> pd.DataFrame:
    """Rank stars by Isolation Forest anomaly score (higher = more unusual)."""
    print("Phase 5  Scoring anomalies…")
    cols = [c for c in feats.columns if c != "tic_id"]
    X = RobustScaler().fit_transform(feats[cols].replace([np.inf, -np.inf], np.nan).fillna(0))
    forest = IsolationForest(n_estimators=500, contamination=contamination, random_state=0).fit(X)
    scored = feats.assign(anomaly_score=-forest.score_samples(X),
                          is_anomaly=forest.predict(X) == -1)
    return scored.sort_values("anomaly_score", ascending=False).reset_index(drop=True)


# ---------------------------------------------------------------------------
# Driver
# ---------------------------------------------------------------------------

def main():
    parser = argparse.ArgumentParser(description=__doc__,
                                     formatter_class=argparse.RawDescriptionHelpFormatter)
    parser.add_argument("--sectors", type=int, nargs="*", default=None,
                        help="TESS sectors to use (default: all available)")
    args = parser.parse_args()
    DATA_DIR.mkdir(parents=True, exist_ok=True)

    members = query_members()
    members.to_csv(DATA_DIR / "gaia_members.csv", index=False)

    stars = crossmatch_tic(members)
    stars.to_csv(DATA_DIR / "tic_matched.csv", index=False)

    curves = download_all(stars, args.sectors)
    feats = extract_features(curves)
    ranked = score_anomalies(feats).merge(stars, on="tic_id", how="left")
    ranked.to_csv(DATA_DIR / "anomaly_ranking.csv", index=False)

    print(f"\nDone. {len(curves)} light curves analysed; "
          f"{int(ranked['is_anomaly'].sum())} flagged as anomalous.")
    print(ranked.head(10)[["tic_id", "anomaly_score", "n_flares", "period_days", "amplitude"]]
          .to_string(index=False))


if __name__ == "__main__":
    main()